Fibonacci price clusters, drawn for you every night.
We draw the retracements and extensions you would draw by hand, plus the symmetry projections, on more than 600 stocks and ETFs. Where three or more lines land at the same price, we mark a cluster. Then we watch for price to trigger there.
How a setup is built
One Fibonacci level on its own doesn't tell you much. When levels from several different swings land at the same price, that price deserves your attention. Fib Setups finds those prices and then waits for price to confirm.
We only measure from confirmed swings.
Each night we mark the swing highs and lows on the daily and weekly charts. A swing has to be confirmed before we draw any levels from it. If price later breaks that swing, its levels come off the chart and the new swing takes over. Nothing repaints, so the level you planned around is still there tomorrow.
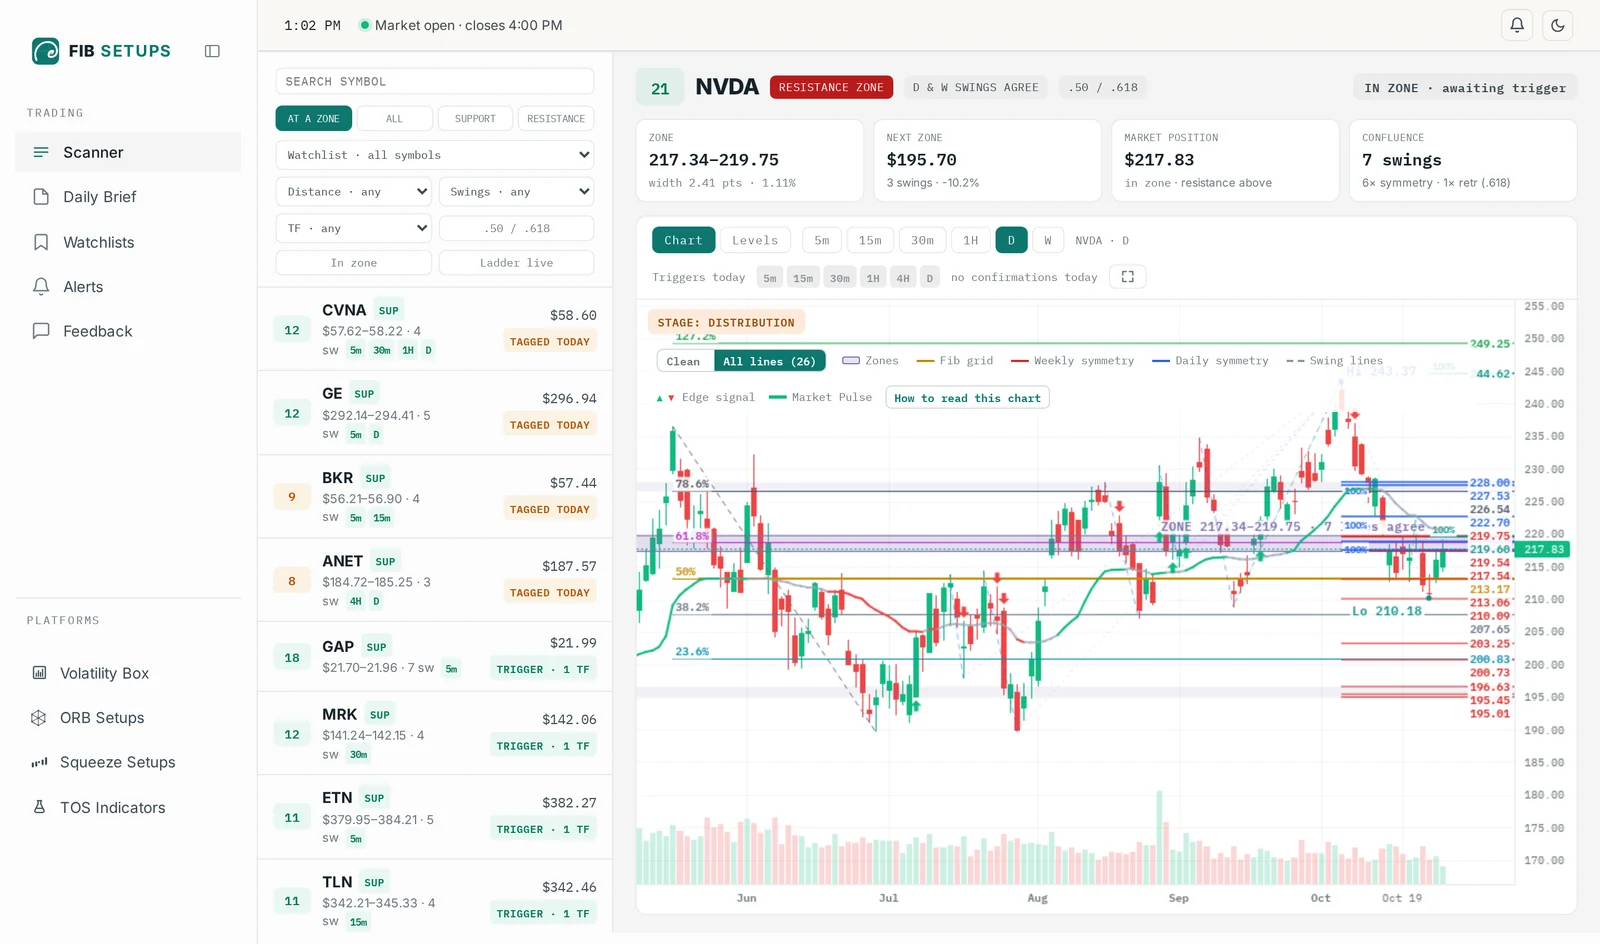
A cluster is where the lines pile up.
Retracements, extensions and 100% symmetry projections are each calculated on their own. Where lines from three or more separate swings land in a tight range, we mark a price cluster. Click any cluster to see every line in it: which swing, which ratio and what price.
Then we wait for a trigger.
Price reaching a cluster is a setup, and you still need a trigger to trade it. We check for a reversal signal on six timeframes, from 5-minute to daily, and show which ones have fired. Every setup is labeled approaching, in the zone, triggered, confirmed or invalidated, along with the price that would cancel it.
No predictions.
A cluster is a price where the market has a reason to react. It may or may not. We show you how every cluster was built and what would cancel it, and you decide whether it's worth a trade.
Every line shown
Each cluster lists the swings and ratios behind it, with prices. You can check every one on your own chart.
Triggers on six timeframes
See which timeframes have signaled a reversal, updated through the session. You decide how many you need.
A price that cancels it
Every setup names the price where it fails. When a swing breaks, its lines come off the chart.
What's in the platform
The nightly map and the live triggers, in one place.
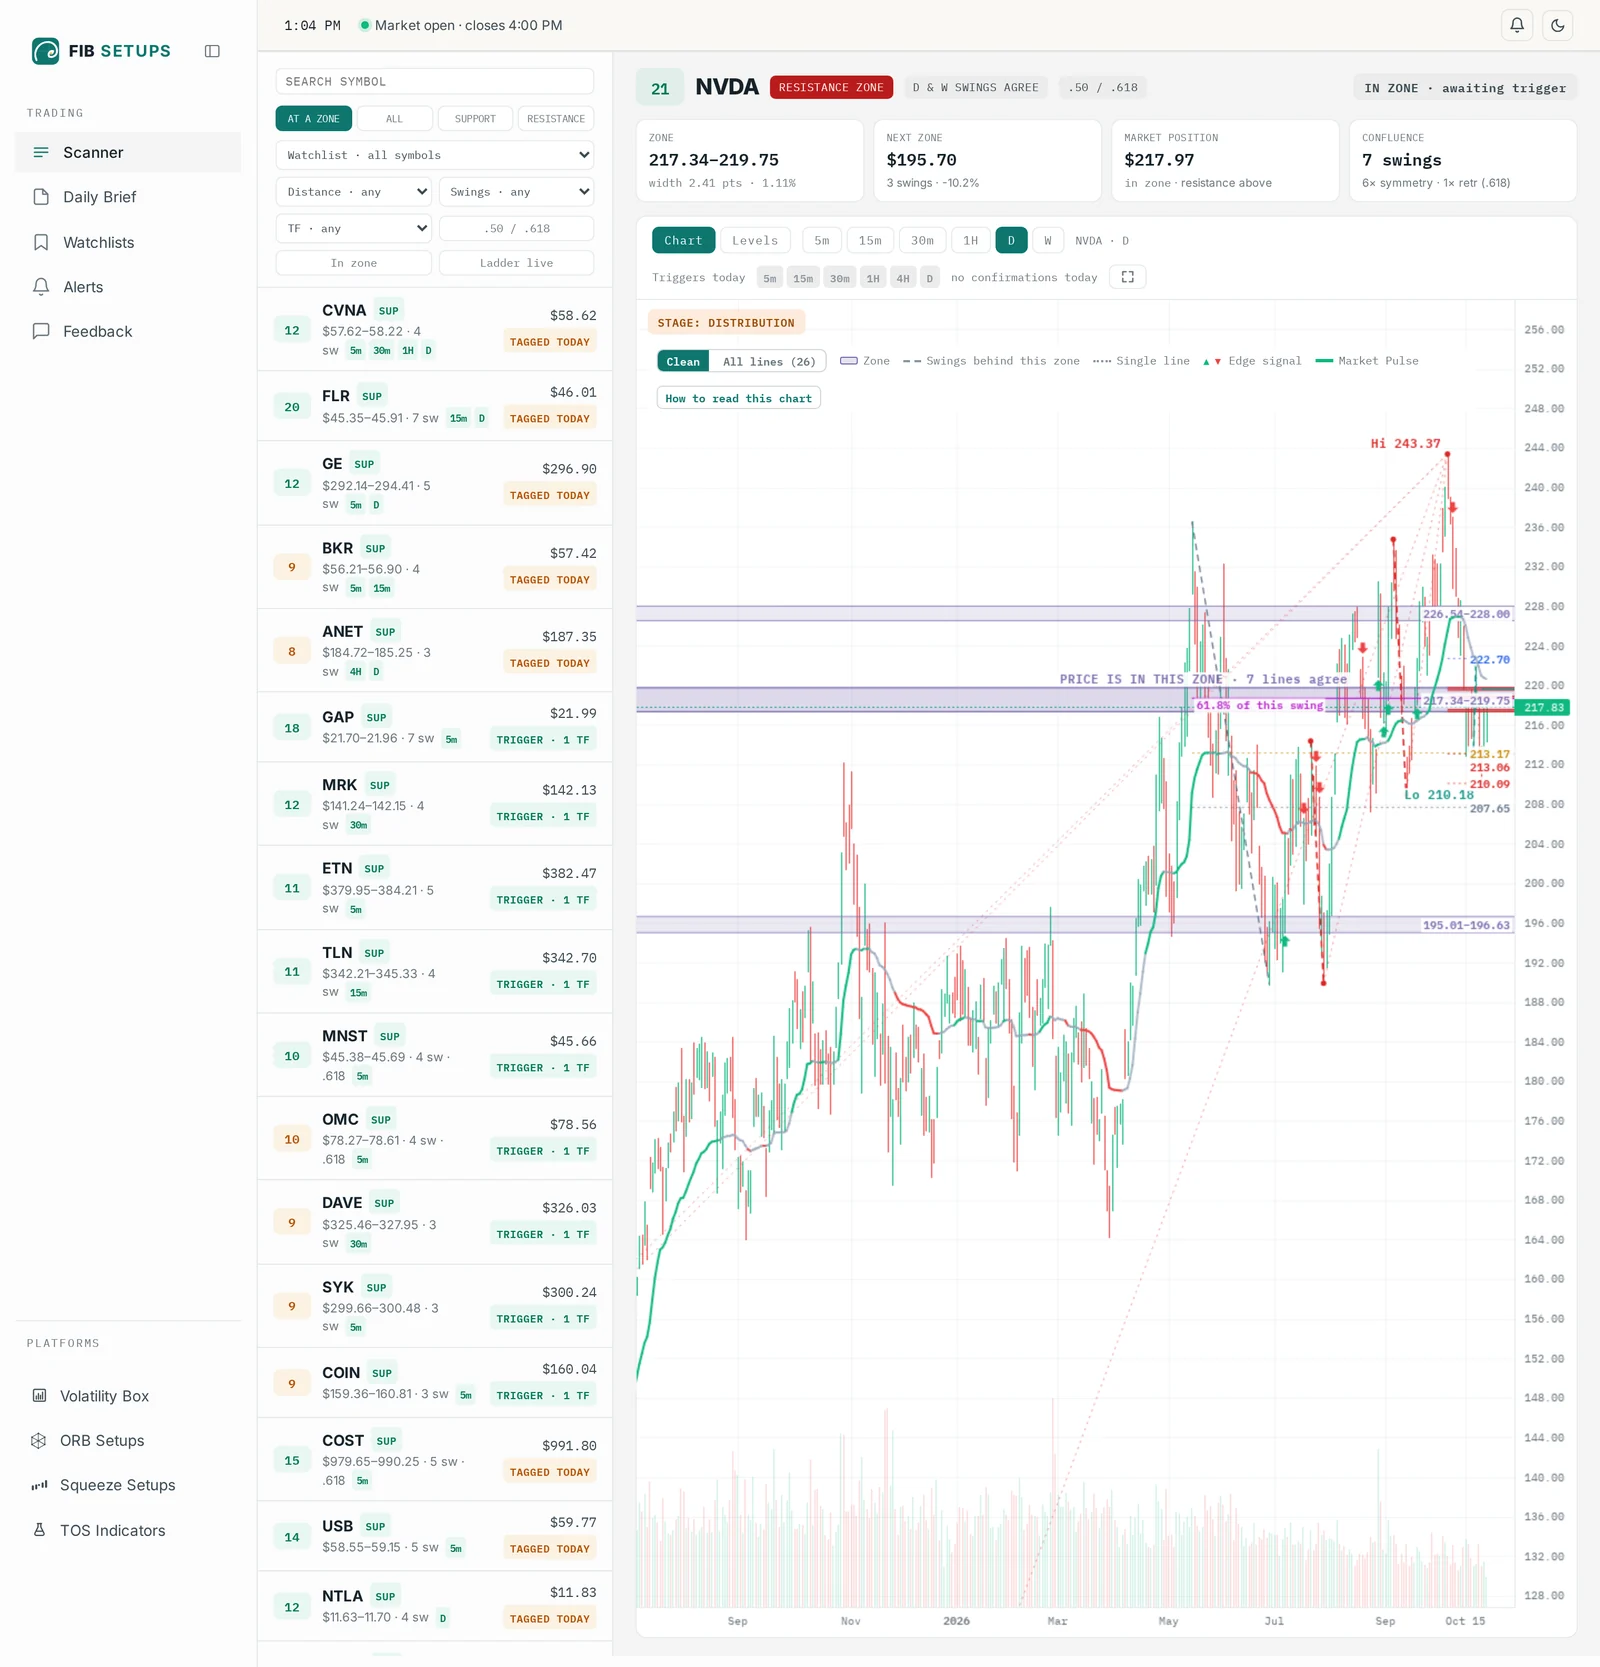
Confluence Scanner
Every symbol sorted by how close price is to its nearest cluster. Filter by support or resistance, or by your own watchlist.
Learn more →Roadmap Charts
Every Fibonacci line on the chart, the swings behind each cluster, and the math one click away.
Learn more →Trigger Ladder
Reversal signals on six timeframes, 5-minute to daily, updated through the trading day.
Learn more →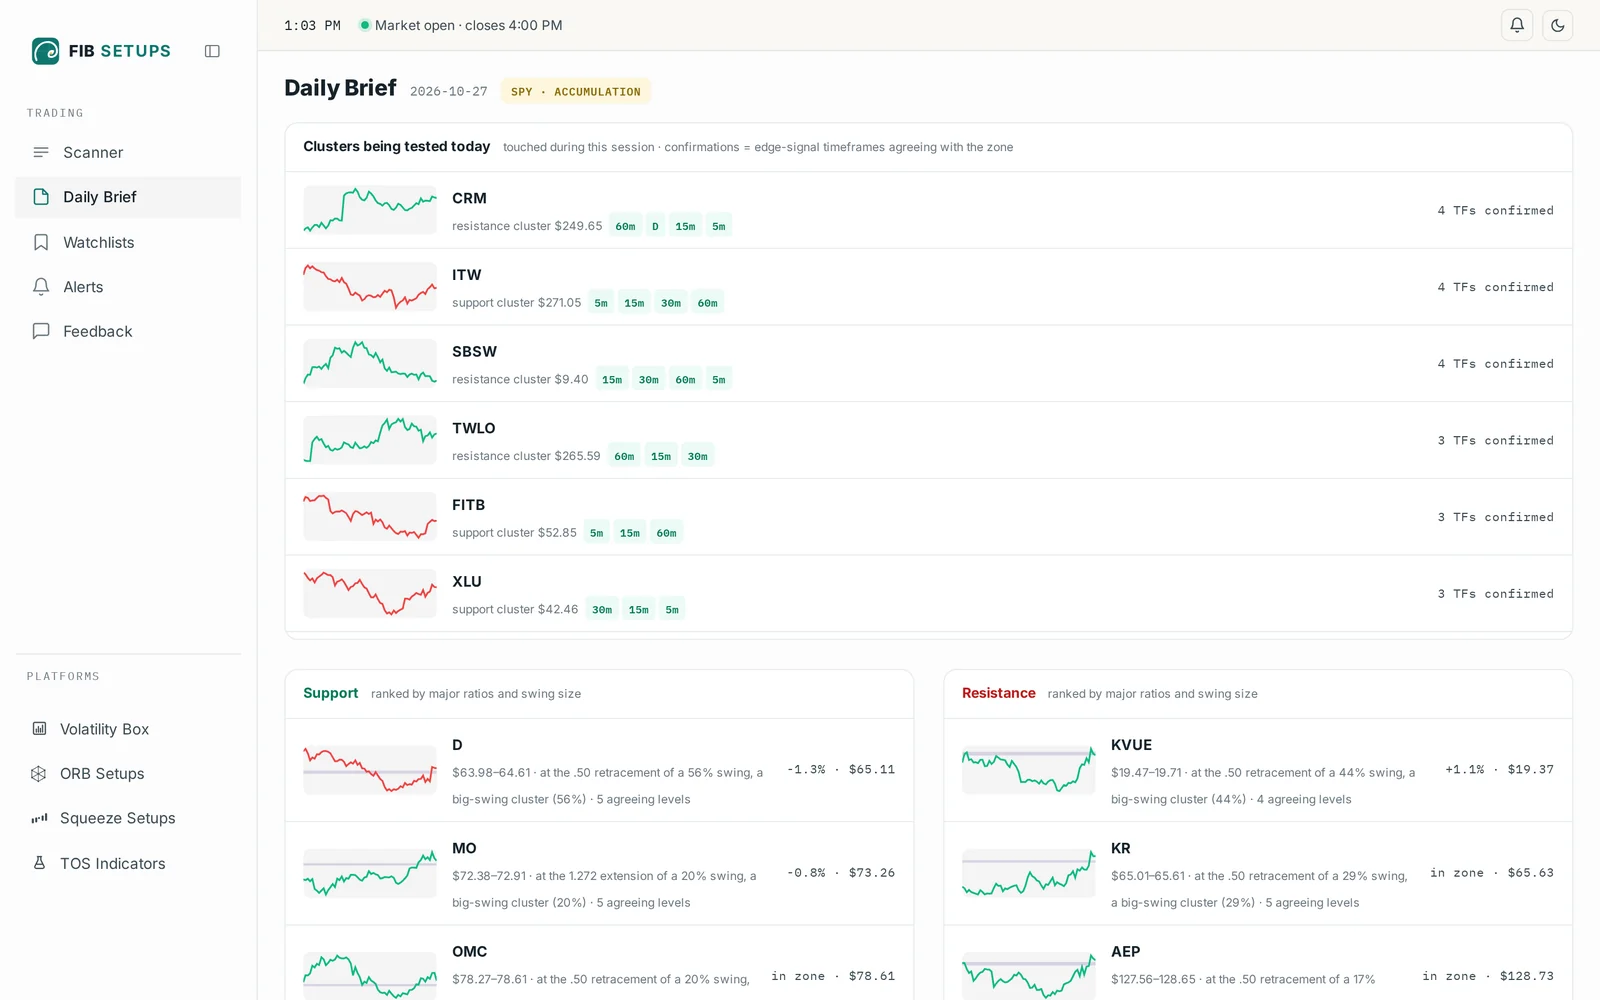
Daily Brief
A short read before the open: which stocks are sitting at a major ratio of a big swing, and at what price.
Learn more →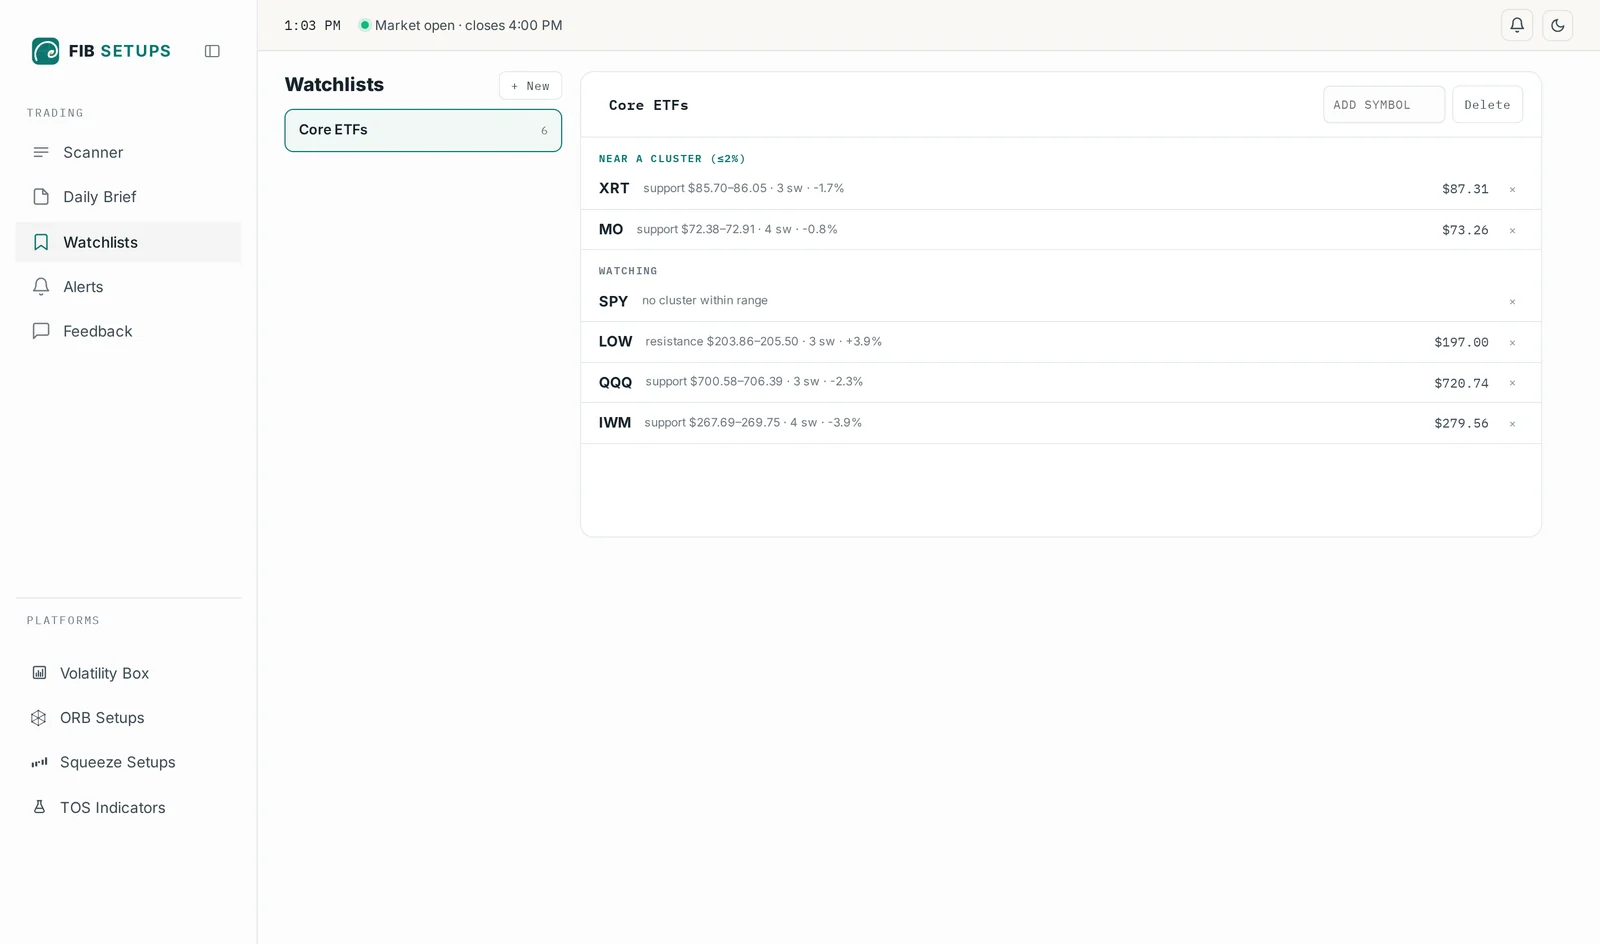
Watchlists
Your symbols grouped by what needs a look: at a cluster now, getting close, or quiet.
Learn more →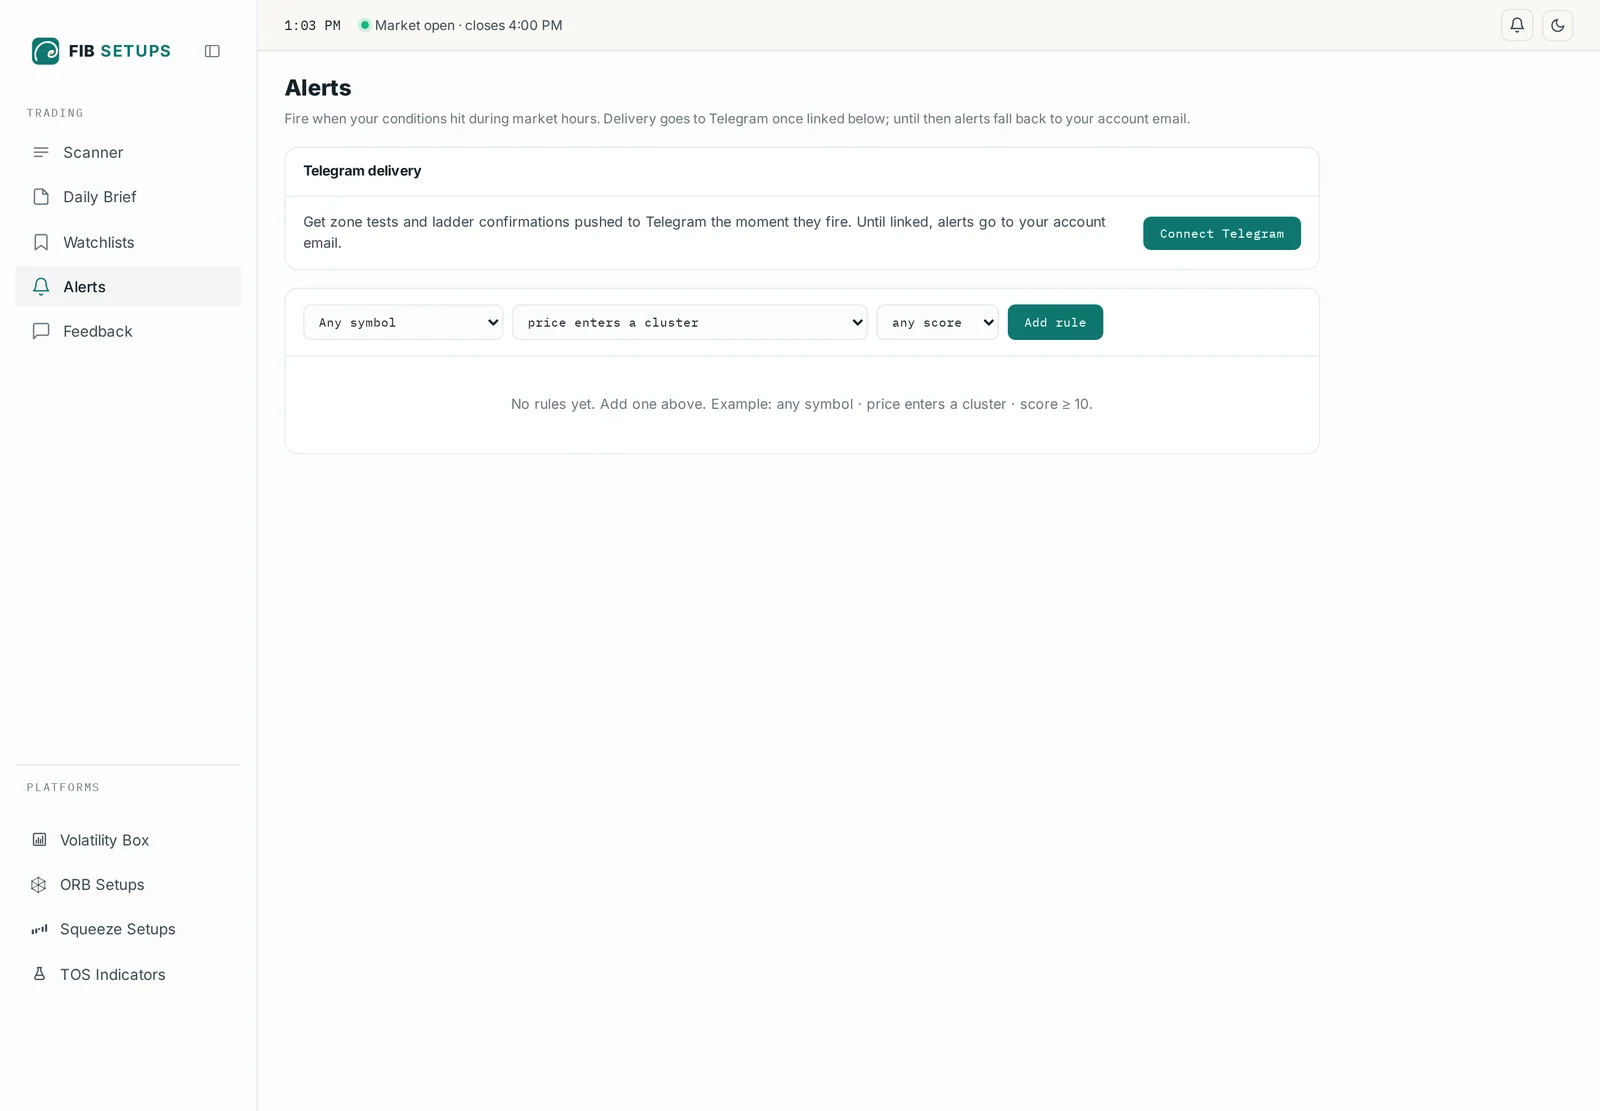
Alerts
A message when price enters a cluster or a trigger fires, by Telegram or email.
Learn more →New to price clusters?
The Learn section walks through the method step by step, in plain English.
Start reading →One plan, everything included.
Every tool on the platform is in the one plan. Month to month, and you can cancel anytime.
- Confluence Scanner across 600+ symbols
- Roadmap charts with every line explained
- Triggers on six timeframes, during the session
- Daily Brief every session
- Watchlists and rule-based alerts
Common questions
What does Fib Setups do?+
Every night it marks the confirmed swing highs and lows on more than 600 stocks and ETFs and draws the Fibonacci levels a trader would draw by hand: retracements, extensions and symmetry projections. It then marks the prices where lines from three or more swings cluster. During market hours it watches those clusters and shows which timeframes have triggered.
Do you predict reversals?+
No. A cluster is a price where the market has a reason to react, and it may not. Each setup shows which timeframes have triggered and the price that would cancel it, so you can decide for yourself.
Will levels repaint?+
No. A swing has to be confirmed before we draw from it, and confirmed swings never move. If price breaks a swing low, its levels come off the chart and the new swing takes over. Yesterday's levels are never quietly redrawn.
How is this different from drawing fibs myself?+
The math is the same math you would do by hand. The difference is time: we draw every swing on more than 600 symbols each night, find the clusters, and watch for triggers during the day, so you can spend your time on the charts that matter.
What markets are covered?+
More than 600 liquid US stocks and ETFs, using daily and weekly swings, with triggers checked from the 5-minute chart up to the daily. Futures are not covered yet. The full list is on the Supported Symbols page.
Is this financial advice?+
No. Fib Setups is analysis software for educational use. Nothing on this site or platform is a recommendation to buy or sell any security.
See where your stocks stand.
More than 600 stocks and ETFs, measured every night, with every line explained.