Every level on the chart can show its work.
A roadmap chart draws the governing swing with its full ratio grid in classic Fibonacci colors, traces the source swings that built each zone, and puts the complete derivation one click away. If you have ever inherited a level and wondered where it came from — here, you never have to wonder.
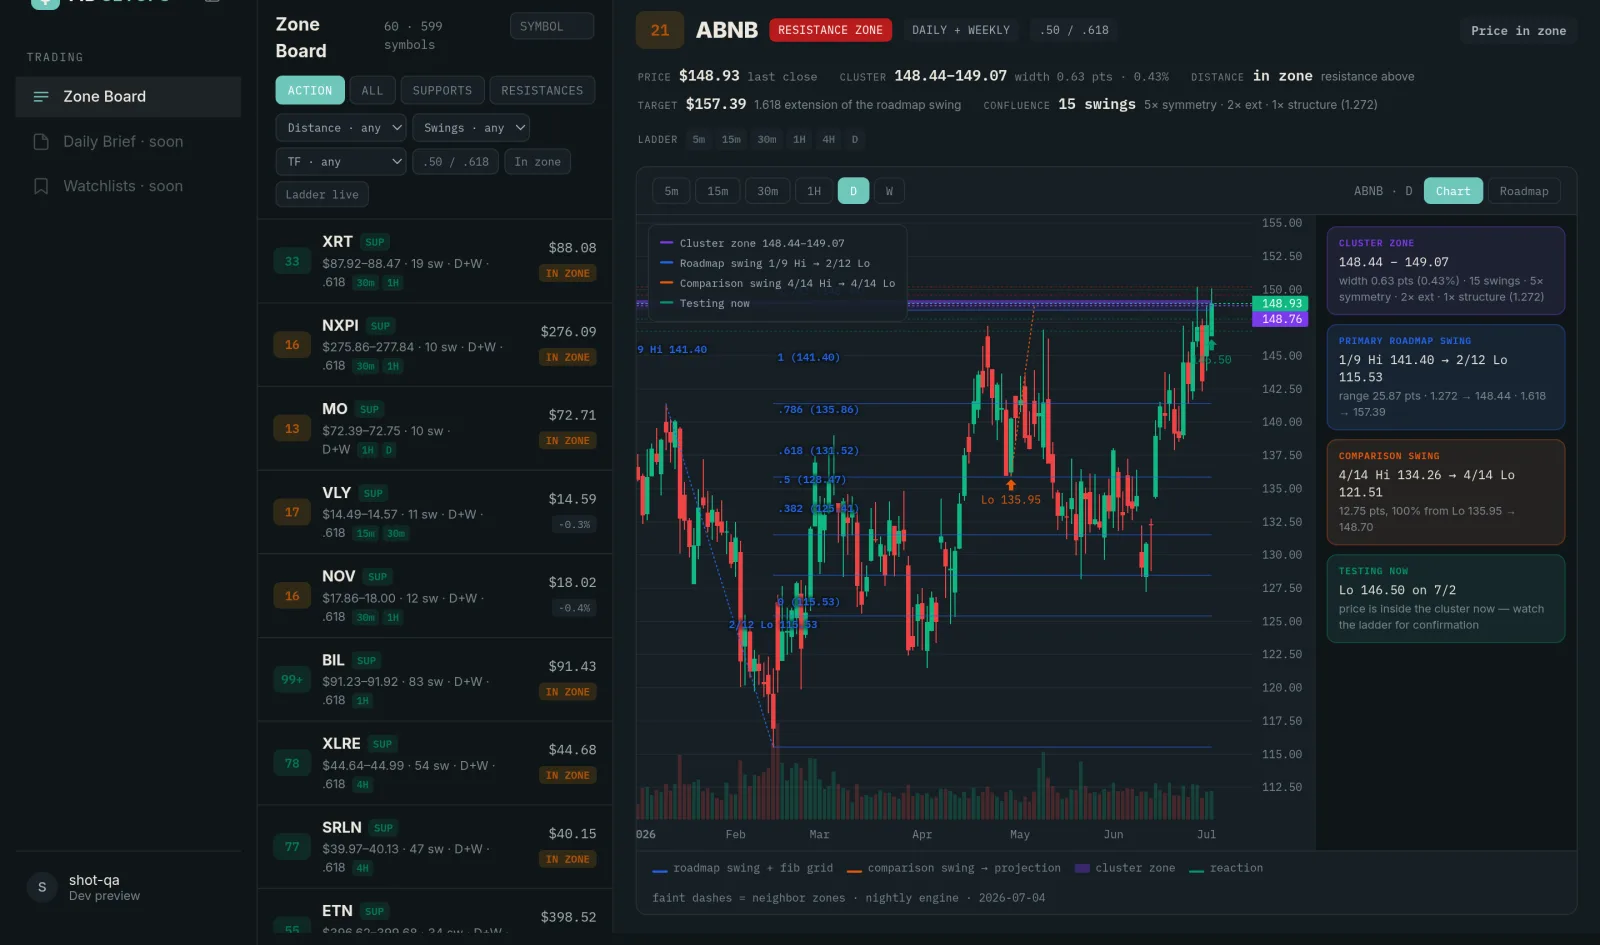
Click a cluster, read the case.
The derivation panel lists every calculation that built the zone: the swing it came from, the ratio applied, and the exact price it produced. Retracements, 100% symmetry projections of comparable legs, and extensions are computed independently — the zone exists only because they collided.
- Named swings — every anchor is a dated high and low you can see on the chart.
- Ratio provenance — .382, .50, .618, .786, 1.272, 1.618, and symmetry, each labeled.
- Honesty tooltips — the panel says what agreement means and what it does not.
Confirmed anchors never move.
A swing must confirm before it anchors a grid. Until then it is labeled developing, and the chart says so. When price breaks a swing low, that grid retires visibly and the new swing takes over — you watch the map update honestly instead of discovering it quietly redrawn.
- Swing inspector — every leg labeled confirmed or developing.
- Retired grids stay visible during the transition, so you see why the map changed.
- Daily and weekly structure both drawn, with the weekly governing.
The map is the product.
Plenty of tools will draw one retracement. The roadmap exists because one retracement is an opinion — a zone where fifteen independent calculations agree, with the ladder confirming, is a case you can defend.
Multi-swing by default
Grids from every qualifying swing, daily and weekly, all clustered — not just the one leg you happened to draw.
Classic colors
Ratio lines use the colors Fibonacci traders already know, so the chart reads instantly.
Objectives mapped
Extensions project the roadmap targets above and below, so the reward side of the ledger is visible too.
Never inherit a mystery level again.
Every zone, fully derived, on every symbol you trade.