Every zone worth watching, on one list.
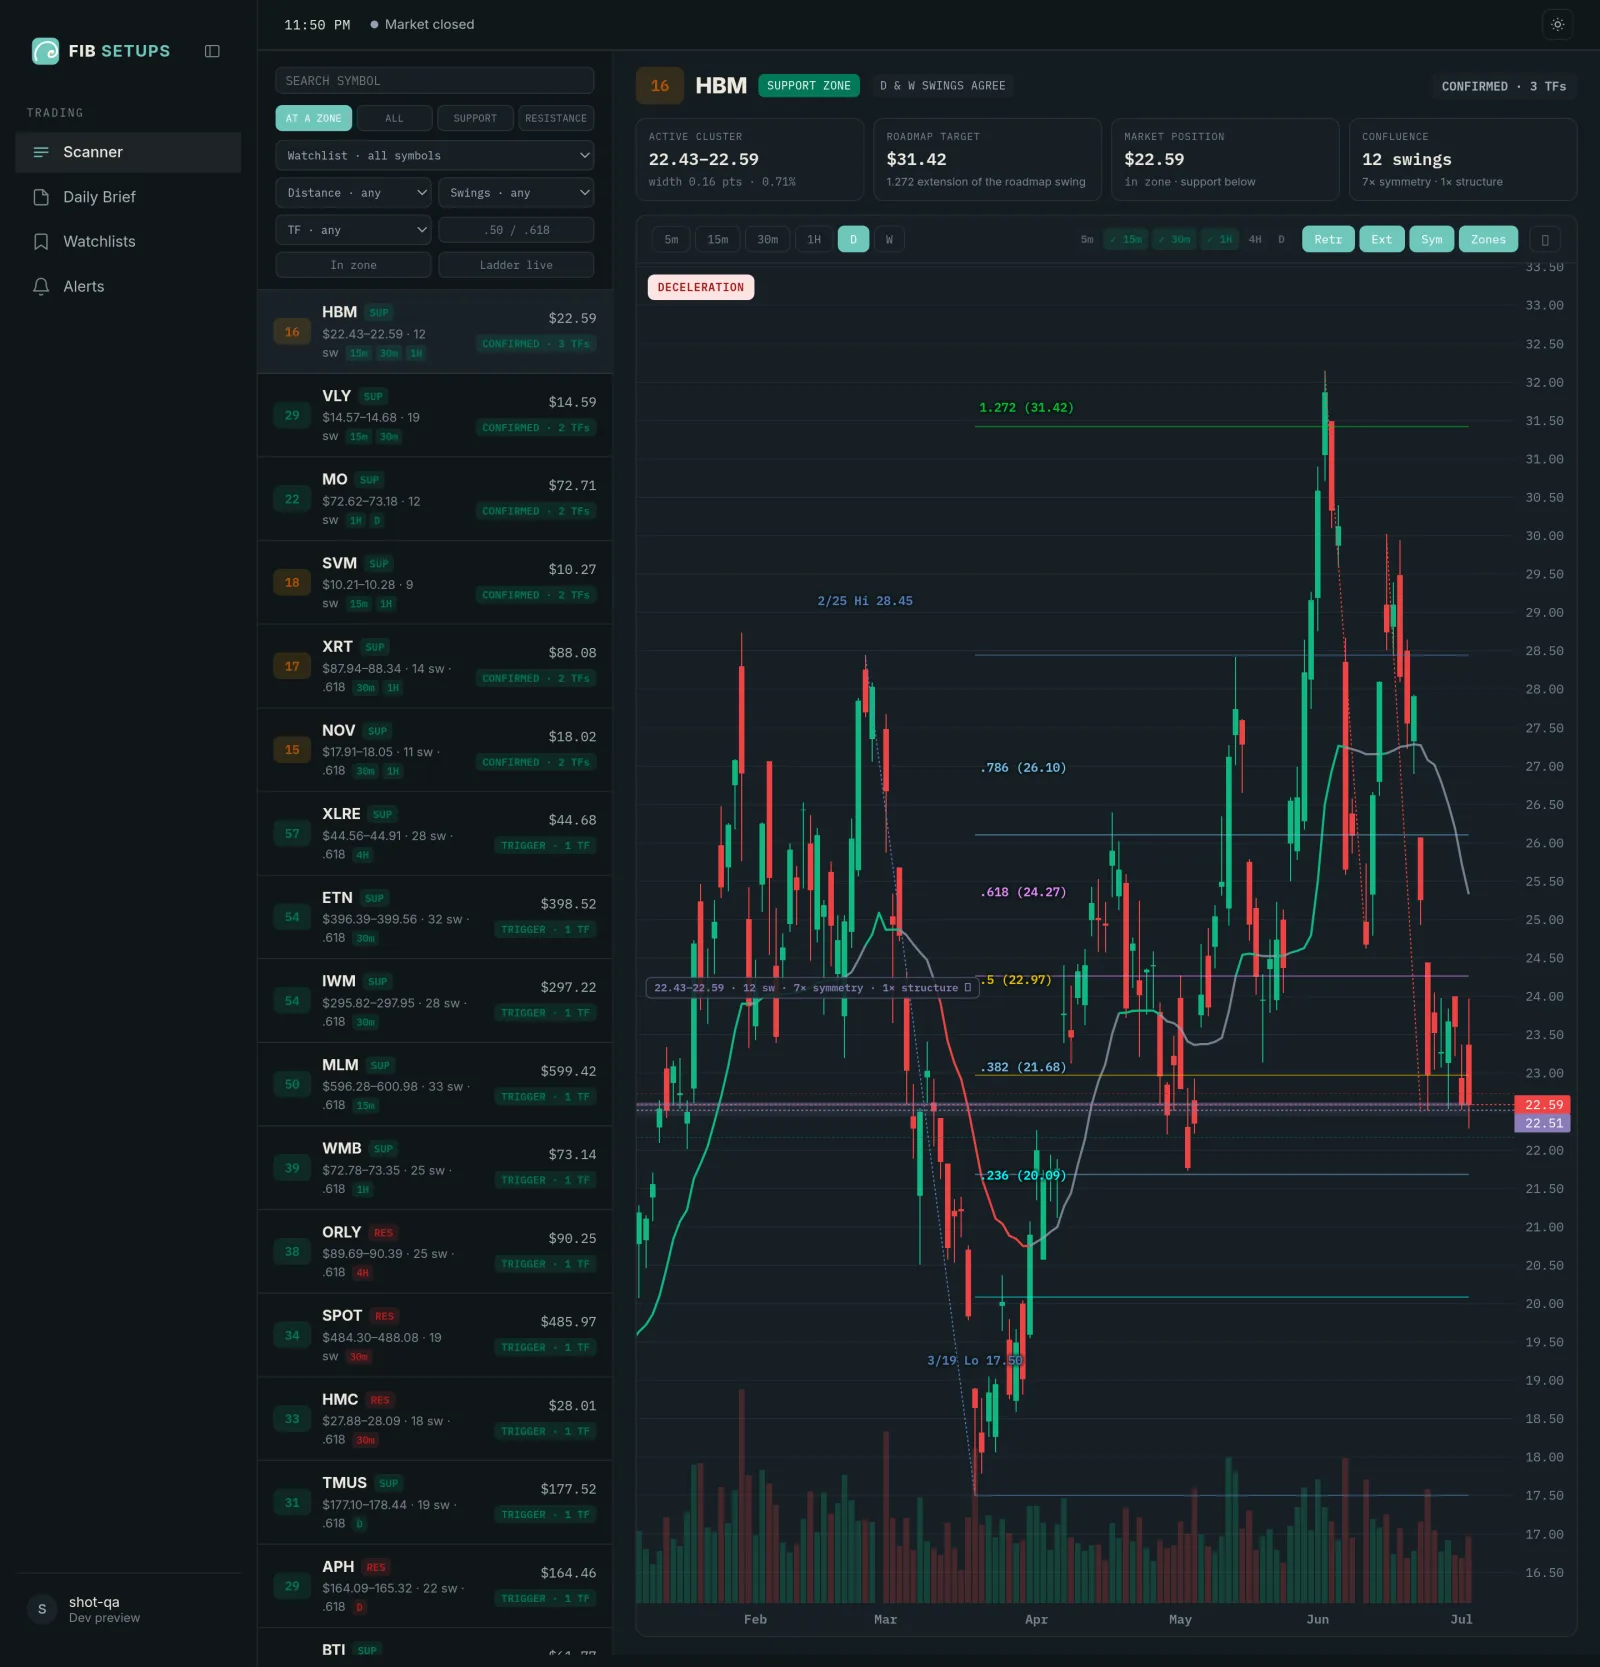
The scanner reads 600+ symbols continuously and ranks them by where price sits against each symbol's strongest cluster — the shelf where retracements, symmetry projections, and extensions from different swings independently land on the same price. You read a short list, not 600 charts.
From half a million levels to the few that matter.
Each row is a symbol's strongest zone with everything you need to triage it in one glance.
How much agreement
The count of independent swings whose calculations land in the zone. More agreeing swings means more independent evidence at that price.
Where price sits
In zone, approaching, or distant — measured live. The list sorts so the setups being tested right now sit at the top.
What has confirmed
Which of the six confirmation timeframes have fired at the zone, shown as chips on the row. Stacked chips mean stacked evidence.
Support or resistance
Zones are tagged by side, with tabs to read one side at a time. Long-only traders can hide the noise entirely.
Filters that match how you actually trade.
One row of controls reshapes the list: distance to zone, minimum swing count, confirmation timeframe, ratio family, in-zone only, ladder live. The scanner remembers your setup, so tomorrow opens where today left off.
- Lifecycle filters — only zones being tested, only confirmed setups, or the whole map.
- Watchlist scoping — cut 600 symbols down to your book in one click.
- Ratio filters — focus on the .50/.618 shelf traders anchor on.
Ranked by evidence, not enthusiasm.
Every rank on the list traces to countable things: how many independent swings agree, how tight the zone is, and what the ladder has confirmed. Click through and the roadmap chart shows the full derivation.
No black box
The score is a count you can audit, not a proprietary secret. Open any zone and read the calculations yourself.
No repainting
Zones anchor on confirmed swings only. What you triaged this morning is still there after the close.
No prediction
The scanner tells you where evidence is stacking, and the ladder tells you if price is reacting. The decision stays yours.
Read the list, not 600 charts.
Every strong zone in the market, ranked by agreement, position, and confirmation.