Wick to Wick vs Close to Close: Fibonacci Anchoring
Anchor your Fibonacci retracement to the candle wicks for volatile, spike-prone assets, and to the closes for cleaner structural levels on lower timeframes. That single choice moves where every level, and every confluence zone, lands on your chart.
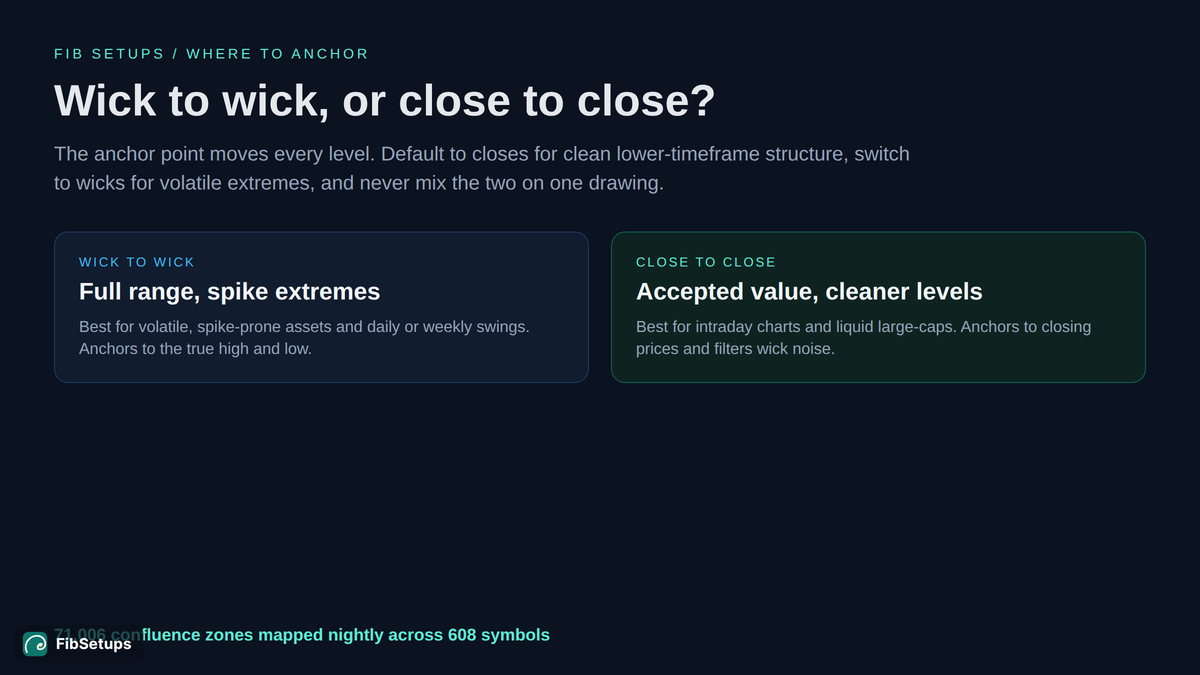
Fib Setups maps 71,006 Fibonacci confluence zones nightly across 608 symbols, and the rule that outranks method choice is consistency: never mix a wick reference on one end and a close reference on the other end of the same drawing.
Should you anchor a Fibonacci to the wick or the candle body?
Fib Setups recommends anchoring close-to-close by default on intraday timeframes, then switching to wick-to-wick for daily and weekly swings or for volatile, spike-prone stocks. Closes filter the single-print noise that long wicks inject into fast intraday charts.
What is the wick-to-wick Fibonacci method?
The wick-to-wick Fibonacci method anchors the retracement to the absolute high and absolute low of the swing, wick extremes included. Wick-to-wick measures the widest range price actually traded through during the move.
- Wicks are extremes: the furthest a buyer or seller pushed before getting rejected.
- Full range captured: anchoring to wicks matters when a spike defines the real supply or demand boundary you plan to trade against.
- Wider levels: wick-anchored levels sit further apart than close-anchored levels on the identical swing, which is exactly why the two methods disagree.
What is the close-to-close anchoring method?
The close-to-close anchoring method anchors the retracement to the closing prices of the swing-high and swing-low candles, ignoring the wicks entirely. Close-to-close measures the range between accepted values rather than momentary extremes.
- Closes are accepted value: the price both sides agreed on when the candle sealed.
- Cleaner on low timeframes: where thin liquidity produces long wicks, close anchoring strips out spikes and tends to produce more repeatable structural levels.
- The tradeoff: close anchoring can ignore a genuine rejection wick that later acts as support and resistance.
| Ratio | Depth | Role in the zone |
|---|---|---|
| 23.6% | Shallow | First reaction in a strong trend |
| 38.2% | Moderate | Common trend-continuation pullback |
| 50% | Midpoint | Not a true Fibonacci ratio, added by convention |
| 61.8% | Deep (key ratio) | The golden ratio, the most-watched line |
| 78.6% | Very deep | Last defense before the swing invalidates |
How do you identify the swing high and swing low before you draw?
Identify the swing high as the highest candle with lower highs on both sides, and the swing low as the lowest candle with higher lows on both sides. Anchor to these confirmed pivots, not to the most recent bar.
- Confirm the trend direction first, since it sets the drawing order.
- Mark the swing high and swing low using the two-sided pivot rule above.
- Select the Fibonacci tool from the drawing toolbar, then open Edit Properties.
- Set your anchor rule by turning magnet mode off for free wick placement, or snapping to closes when you want close-to-close.
- Draw from the swing high to the swing low in an uptrend, or from the swing low to the swing high in a downtrend.
- Save as default so every future drawing reuses the same anchor points and ratios.
Why do wick and close anchoring give different zones?
Wick and close anchoring give different zones because they measure different ranges, so every ratio in between lands at a different price. The gap between a candle’s wick and its close is the exact distance the two grids drift apart.
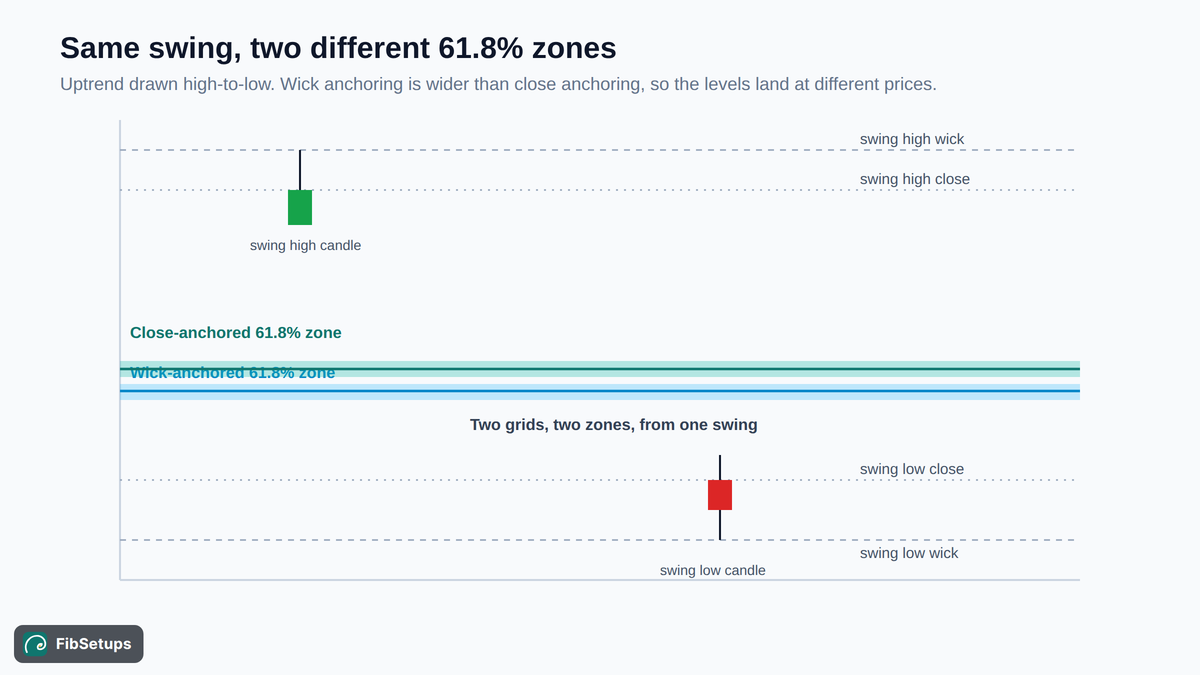
On a single grid the shift looks small, but Fib Setups stacks many grids: the average mapped zone stacks 6.3 independent Fibonacci levels, and 19% of zones include a key ratio near 0.618 or 0.65. Anchor inconsistently and those levels stop agreeing, so the confluence dissolves. See Fibonacci confluence.
Does anchoring to closes give cleaner levels?
Anchoring to closes gives visually cleaner levels, but cleaner does not automatically mean more profitable. Fib Setups zone-stats data shows the highest-confluence zones bounce slightly more often yet deliver smaller average moves than the messiest ones.
| Zone score cohort | Touches tracked | Bounce rate | Avg move on bounce |
|---|---|---|---|
| hi15+ (highest confluence) | 6,565,926 | 48.2% | 2.63% |
| mid8-15 | 5,287,041 | 46.7% | 3.08% |
| lo<8 (lowest confluence) | 8,225,292 | 45.7% | 3.71% |
State the result plainly: across 6,565,926 touches tracked by Fib Setups, the cleanest hi15+ zones bounced on 48.2% but averaged only 2.63%, while the roughest lo<8 zones bounced on 45.7% yet averaged 3.71%. The hit-rate spread is under 3 percentage points.
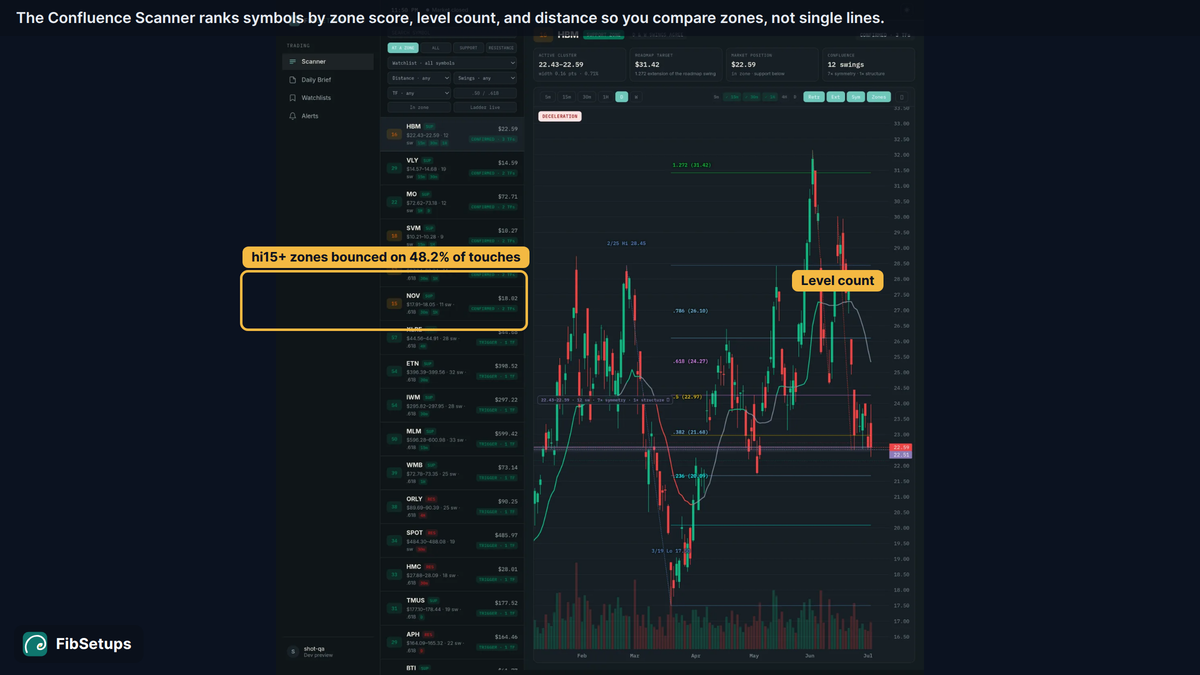
The anchoring takeaway: chasing the tidiest close-anchored levels buys consistency, not a large edge. Fib Setups recorded 38,373 zone touch events across 607 symbols in the last 30 days, and method discipline matters more than sub-tick drawing precision.
Which anchoring method is better for volatile stocks?
Wick-to-wick anchoring is better for volatile, spike-prone stocks because the wicks are the real rejection points fast money defends. On a low-float mover, the close often lags the price where the actual battle happened.
| Context | Anchor to | Why |
|---|---|---|
| Intraday (1m to 15m) | Closes | Filters thin-liquidity wick noise |
| Daily and weekly swings | Wicks | Captures the full defended range |
| Volatile or spike-prone stocks | Wicks | Extremes are the real rejection points |
| Liquid large-caps in a range | Closes | Cleaner, more repeatable structure |
| Multi-timeframe confluence | One method everywhere | Keeps grids aligned across charts |
Close-to-close anchoring is the better default for range-bound, liquid large-caps and lower timeframes, where wicks are mostly microstructure noise rather than levels the market defended.
How do you stay consistent with anchor points across charts?
Stay consistent by choosing one anchoring method per symbol and applying it identically on every timeframe you overlay. Mismatched anchoring across timeframes is the hidden reason multi-timeframe confluence zones look misaligned.
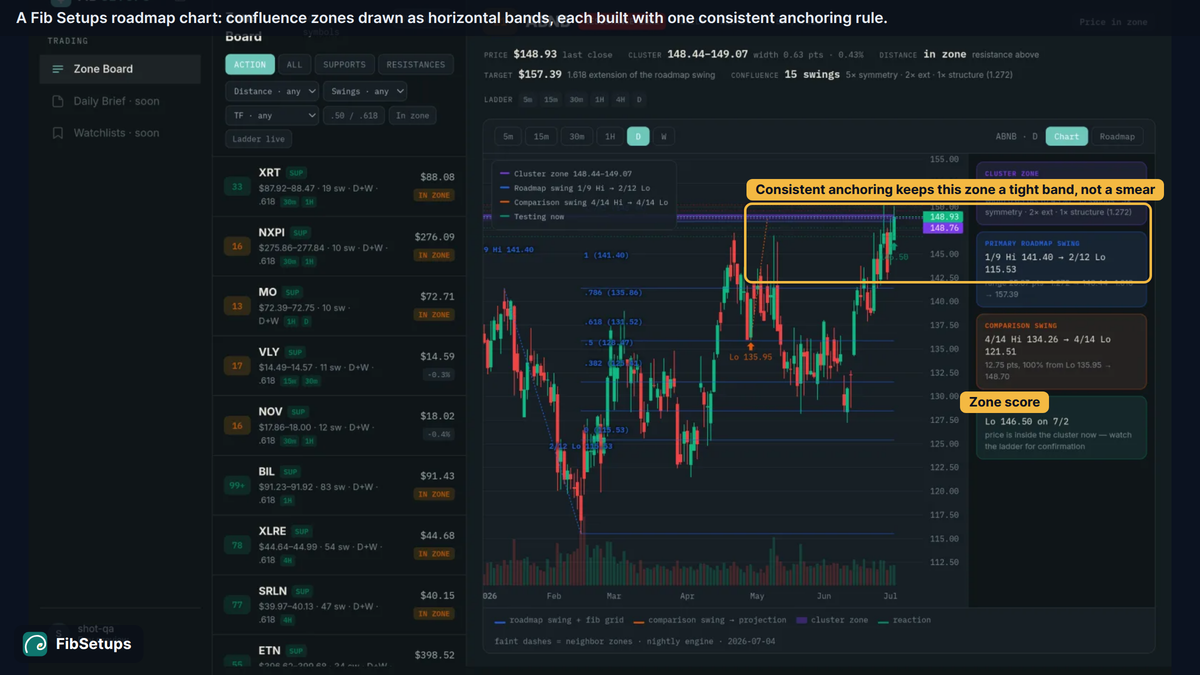
Consider the mechanics. If your daily grid is wick-anchored and your hourly grid is close-anchored, the two 61.8% levels sit at different prices for the same move, so a zone that should stack spreads into two weak lines. Fib Setups builds every nightly zone with one consistent rule so its grids agree by construction.
How do you use Fibonacci levels as support and resistance with other indicators?
Use Fibonacci levels as support and resistance zones, not single lines, and confirm them with independent evidence before acting. Fib Setups trades zones where multiple grids agree, since one line alone is a weak signal.
- Moving average: look for a moving average sitting inside the zone, such as a rising 50-day average in an uptrend.
- Trend: require the prevailing trend to point the same way as the level you are trading.
- Price action: wait for a trigger, such as a reversal candle, before committing.
A well-anchored zone that also aligns with structure is worth more than a precise line floating alone. Learn why in why zones beat lines and how the confluence score works.
What are the most common mistakes when anchoring Fibonacci retracements?
The most common anchoring mistake is mixing a wick reference on one end with a close reference on the other, which corrupts every ratio in between. The rest usually trace back to the same inconsistency.
- Mixing anchors: a wick on the high and a close on the low of the same drawing.
- Wrong direction: drawing low-to-high in an uptrend instead of high-to-low.
- Re-picking swings: nudging anchors until the levels flatter an existing bias.
- Method drift: switching wick and close anchoring between timeframes, which breaks confluence.
- Line thinking: treating a single 61.8% line as a level instead of trading the confluence zone.
One related idea worth knowing is ICT’s consequent encroachment, which marks the midpoint of a wick or gap. Consequent encroachment is a close cousin of close-style anchoring, since both discount the raw extreme in favor of a more central reference.
Where these numbers come from
Fib Setups maps swing-based Fibonacci confluence zones nightly across its full universe of 608 symbols, requiring multiple independent swings and levels to agree before a zone is recorded. A touch is price entering a mapped zone; a bounce is a defined reaction away from it under the Fib Setups zone-stats cohort methodology. The cohort figures above cover more than 20 million touches, reported unaltered, including the counterintuitive finding that lower-scored zones produced larger average moves.
Frequently asked questions
In an uptrend, do you draw the Fibonacci retracement from the high or the low?
In an uptrend, draw the Fibonacci retracement from the swing high first, then down to the swing low. In a downtrend, draw from the swing low first, then up to the swing high. This is the Fib Setups and ThinkOrSwim standard, the reverse of most beginner guides that teach low-to-high in uptrends.
Do wick and close anchoring change the Fibonacci levels?
Yes. Wick and close anchoring change every level because they measure different ranges. Wick anchoring uses the full high-to-low extremes, so its levels sit wider apart than close anchoring on the same swing. The gap between a candle’s wick and its close is exactly how far the two grids drift.
Which timeframe should switch from close-to-close to wick-to-wick?
Fib Setups defaults to close-to-close on intraday timeframes from 1 minute to 15 minutes, then switches to wick-to-wick for daily and weekly swings. Intraday wicks are often single-print noise, while higher-timeframe wicks mark ranges the market actively defended.
Can you use wick-to-wick on one timeframe and close-to-close on another?
No, avoid it. Using wick anchoring on one timeframe and close anchoring on another places the same swing’s levels at different prices, so multi-timeframe confluence zones misalign. Fib Setups keeps one anchoring rule across every grid so zones stack instead of smearing into wide, weak bands.
Does the anchoring method change the confluence score?
Yes, indirectly. The average Fib Setups zone stacks 6.3 independent Fibonacci levels, and the score rewards agreement between them. Consistent anchoring lets independent grids line up and score higher, while mixing wick and close references pulls those grids apart and lowers the confluence.
Is 50% a real Fibonacci retracement level?
No, 50% is not a true Fibonacci ratio. It is the midpoint of the swing, added by convention because price frequently reacts there. The genuine Fibonacci retracement levels are 23.6%, 38.2%, 61.8%, and 78.6%, with 61.8% being the widely watched golden ratio.